
Bitcoin price is one of the most-watched numbers in finance. Traders, long-term investors, and newcomers to crypto follow it every day. That is because Bitcoin sits at the centre of the digital asset market and often sets the tone for the rest of crypto.
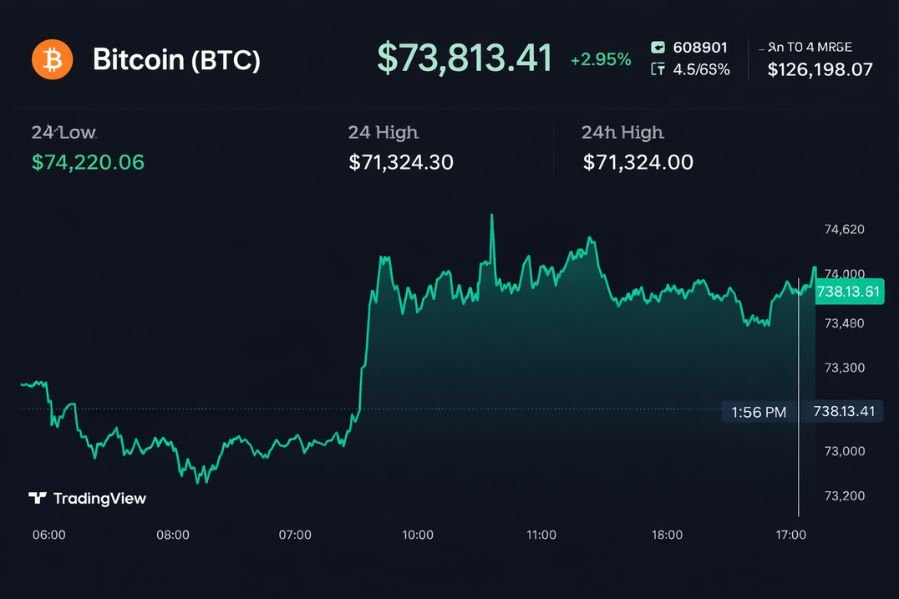
According to the latest market data, Bitcoin is trading near $73,813. It is up about 2.94% on the day, with an intraday range of $71,324 to $74,220. Around 20 million BTC are already in circulation, while the total supply is capped at 21 million. That limited supply is one of the main reasons many people track Bitcoin so closely.
Bitcoin’s recent move back toward the mid-$70,000s has drawn fresh attention. Some reports link the rise to stronger spot demand and renewed ETF inflows. Others point to rising whale activity on exchanges. These signals matter, but they do not all mean the same thing. Some support a bullish case, while others suggest volatility may still lie ahead.
Contents
- What is the Bitcoin price?
- Why does the Bitcoin price move so much
- Bitcoin price history in simple terms
- Where Bitcoin stands now
- Why supply matters
- ETF flows and institutional demand
- Whale activity explained
- Risks investors still watch
- Conclusion
- FAQs
- SEO meta description
Quick Facts About Bitcoin Price
| Asset | Bitcoin (BTC) |
| Latest Price | About $73,813 |
| 24h Change | About +2.94% |
| Intraday Range | $71,324 to $74,220 |
| Circulating Supply | About 20.0 million BTC |
| Maximum Supply | 21 million BTC |
| Launch Year | 2009 |
| Latest Halving | April 2024 |
| Next Halving | Expected in 2028 |
Sources: live market data and Bitcoin reference material.
What Is Bitcoin Price?
The Bitcoin price is the market value of one Bitcoin. It is usually quoted in U.S. dollars. The figure changes constantly because Bitcoin trades all day, every day, across exchanges worldwide.
That price comes from real buying and selling. When demand rises, the market can move up fast. When sellers take control, it can fall just as quickly. Bitcoin has worked this way since the network launched in 2009, after Satoshi Nakamoto published the Bitcoin white paper in 2008.
Why Bitcoin Price Moves So Much
Bitcoin is known for large price swings. There are a few clear reasons behind that.
First, there is scarcity. Bitcoin has a fixed supply, so changes in demand can significantly impact its price.
Another reason is 24/7 trading. Unlike stocks, Bitcoin never closes. News, economic data, and global events can move the market at any hour.
Market sentiment also plays a major role. ETF flows, trader confidence, regulation, and leverage all affect short-term price action. Once momentum builds, Bitcoin often moves faster than traditional assets. Recent market research said Bitcoin’s March 2026 rebound came as selling pressure eased and spot demand improved.
Bitcoin Price History in Simple Terms
The Bitcoin price has gone through many cycles. It has had sharp rallies, deep pullbacks, and long periods of sideways trading. Over time, it grew from a niche digital asset into the largest cryptocurrency by market value.
Recent market coverage placed Bitcoin’s all-time high at about $126,200 in 2025. Since then, the price has pulled back and recovered. That matters because today’s move toward the low-to-mid $70,000s is not happening at a record high. Instead, it occurs during a recovery phase after a major peak.
This history shapes how traders read the current market. A move to $74,000 looks strong, but many are still comparing it to the 2025 high. As a result, some traders see room for more upside, while others focus on resistance and the risk of another pullback.
Where Bitcoin Stands Now
The latest data shows Bitcoin near $73,813, with the day’s high near $74,220. That means BTC is testing an important area after a strong short-term rebound.
Recent reports said spot Bitcoin ETFs saw fresh inflows in March 2026. That helped support the rally. One report also described Bitcoin as hitting a one-month high as investor demand improved. At the same time, macro risks have not disappeared. Markets are still reacting to interest rate expectations, geopolitics, and wider risk sentiment.
The key point is simple: Bitcoin looks stronger than it did earlier in the year, but it is still trading in a market that can turn quickly.
Why Supply Matters
Bitcoin’s fixed supply is one of its most important features. Only 21 million BTC will ever exist. That rule is built into the protocol. Roughly 20 million are already in circulation.
Bitcoin also has a built-in event called the halving. About every four years, the reward paid to miners is cut in half. The latest halving took place in April 2024, reducing the block reward to 3.125 BTC. The next halving is expected in 2028.
The effect is easy to understand. New supply enters the market more slowly over time. If demand rises while new supply stays limited, the price can climb more sharply. That does not guarantee a rally, but it is a big reason many investors keep watching Bitcoin over the long term.
ETF Flows and Institutional Demand
One of the biggest changes in this Bitcoin cycle is the role of institutions. In earlier years, most of the market was driven by retail traders and crypto-native firms. Today, spot ETFs have made Bitcoin more accessible to a wider set of investors.
Strong ETF inflows can support the price. They bring new money into the market and may tighten the supply available. On the other hand, when flows slow down or reverse, sentiment can weaken.
That is why ETF data matters so much now. It is one of the clearest signs of whether large investors are adding exposure or cutting it. Recent reporting linked Bitcoin’s March rebound to stronger ETF inflows and stronger demand.
Whale Activity Explained
Whales are large Bitcoin holders. Analysts often track their activity because large transactions can affect the market.
A widely watched metric is the Exchange Whale Ratio. CryptoQuant says it measures how much of exchange inflows come from the top 10 transactions. In simple terms, it shows how much exchange activity is being driven by very large holders.
This is where many headlines become too simple. A high whale ratio is not always bullish. It can mean large holders are active, but it does not tell the full story on its own. In some cases, the signal may reflect accumulation. In others, it may point to rising sell-side pressure.
A better way to read it is as a sign that whales are playing a bigger role in market action. It should be read alongside ETF flows, price structure, and overall demand.
Risks Investors Still Watch
Bitcoin has bounced, but risk has not gone away.
Investors are still watching:
- whether BTC can hold above the low $70,000s
- whether it can break cleanly above the mid-$74,000 area
- whether ETF demand stays positive
- Whether macro news weakens risk appetite
The current trading range tells part of the story. Bitcoin fell to $71,324 and rose to $74,220 on the same day. That is a large swing for a major asset. It shows both strong interest and ongoing uncertainty.
That mix is normal for Bitcoin. Over the long term, it can look strong. In the short term, it can still remain highly volatile.
Conclusion
Bitcoin price today shows a market that is active, liquid, and still highly sensitive to demand. BTC is trading near $73,813, supported by its fixed supply, renewed ETF interest, and improving short-term momentum. At the same time, traders are still watching whale behaviour, macro events, and key resistance levels around the mid-$74,000 range.
To navigate the market effectively, it is essential to weigh both the progress and uncertainties in Bitcoin’s current cycle. The ongoing rebound points to renewed confidence, while the supply and institutional participation present long-term strengths. Even so, short-term volatility is a constant factor. That is why Bitcoin price remains in focus: it captures shifts in risk sentiment, illustrates global adoption trends, and reflects how investors balance scarcity, demand, and market conviction.
FAQs About Bitcoin Price
1. What is the Bitcoin price today?
Bitcoin is trading near $73,813, according to the latest market feed I have access to.
2. What was Bitcoin’s intraday range?
The latest range is $71,324 to $74,220.
3. Why is Bitcoin so volatile?
Bitcoin trades 24/7 and reacts quickly to demand, news, ETF flows, and trader sentiment. Its fixed supply also adds to price swings.
4. How many Bitcoins are in circulation?
About 20 million BTC are in circulation.
5. What is Bitcoin’s maximum supply?
Bitcoin’s maximum supply is 21 million BTC.
6. When was the last Bitcoin halving?
The last halving took place in April 2024.
7. When is the next Bitcoin halving?
The next halving is expected in 2028.
8. Is whale activity always a bullish sign?
No. It shows strong activity from large holders, but it can point to either accumulation or possible selling pressure.
Disclaimer: This article is for informational purposes only and should not be considered financial, investment, or trading advice. Cryptocurrency prices are highly volatile, and market conditions can change quickly. Readers should verify current data from reliable public sources and consult a qualified financial adviser before making any investment decisions.
For More Information cryptobignews.com